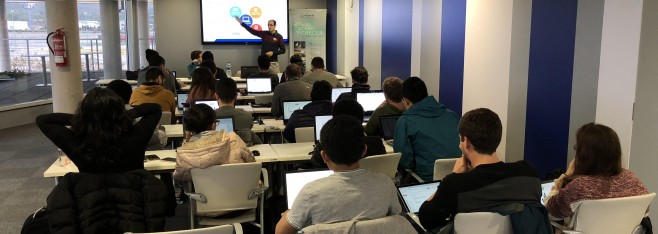
Tableau Course_Feb. 28th, 2018
Mar 26
- posted by Geotech Master
- in Sin categoría
- 0 Comments
Nowadays, dashboards and interactive visualizations techniques are becoming very popular. Among the different tools that we can find in the market we highlight Tableau, which is an interactive data visualization product focused on business intelligence. Thus, if you want to analyze your data geographically, it is also possible to plot data on a map in Tableau. Thus, in the context of the Erasmus Mundus Master of Science in Geospatial Technologies, we organized a day course on Feb. 28th, 2018 tought by official Tableau instructors, Jonathan Martón and José Gastón, centered on the mapping capabilities of this leading tool.
